
The shape of a day on the water.
Tide Guide’s station library already tells part of the story. In our iPhone recording, a single card for The Battery Harbor contains a blue tide curve, labeled turning points, and a current height. The card gives the place a recognizable pattern before it is opened.
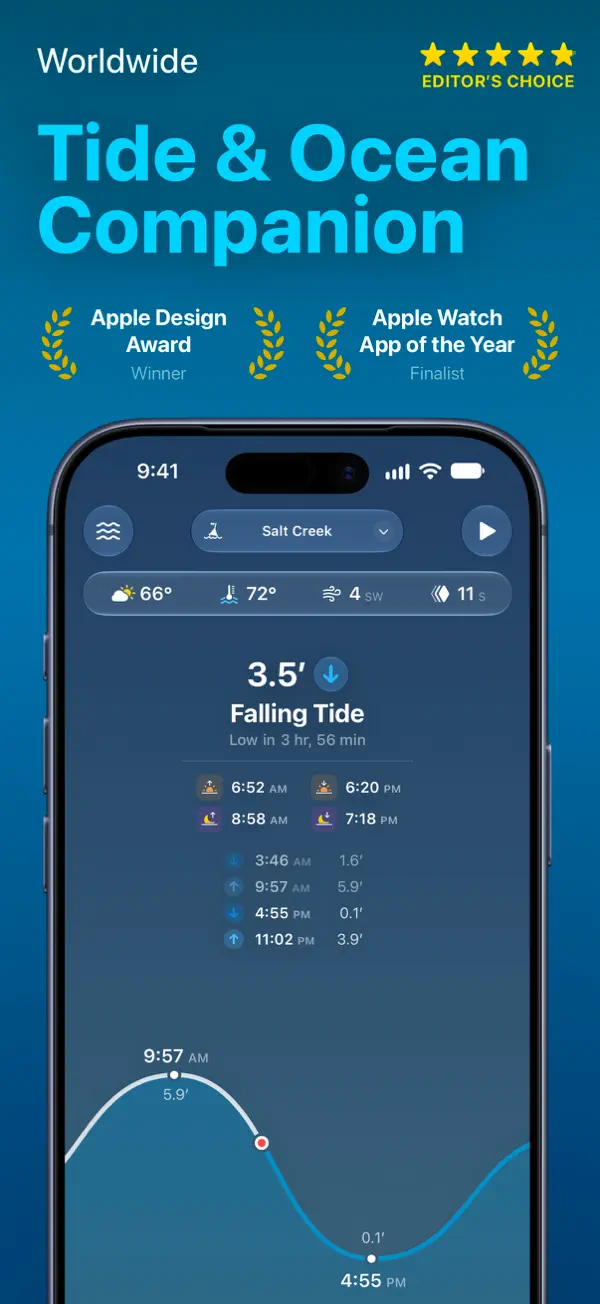
Tapping it expands that compact presentation into the Today view. The station name stays at the top, while the height becomes a large central reading above the words “Falling Tide.” In the recorded example, the display reads 4.5 feet and gives a countdown to the next low. A quick check can begin with that small group of labels; the larger curve below explains their context.
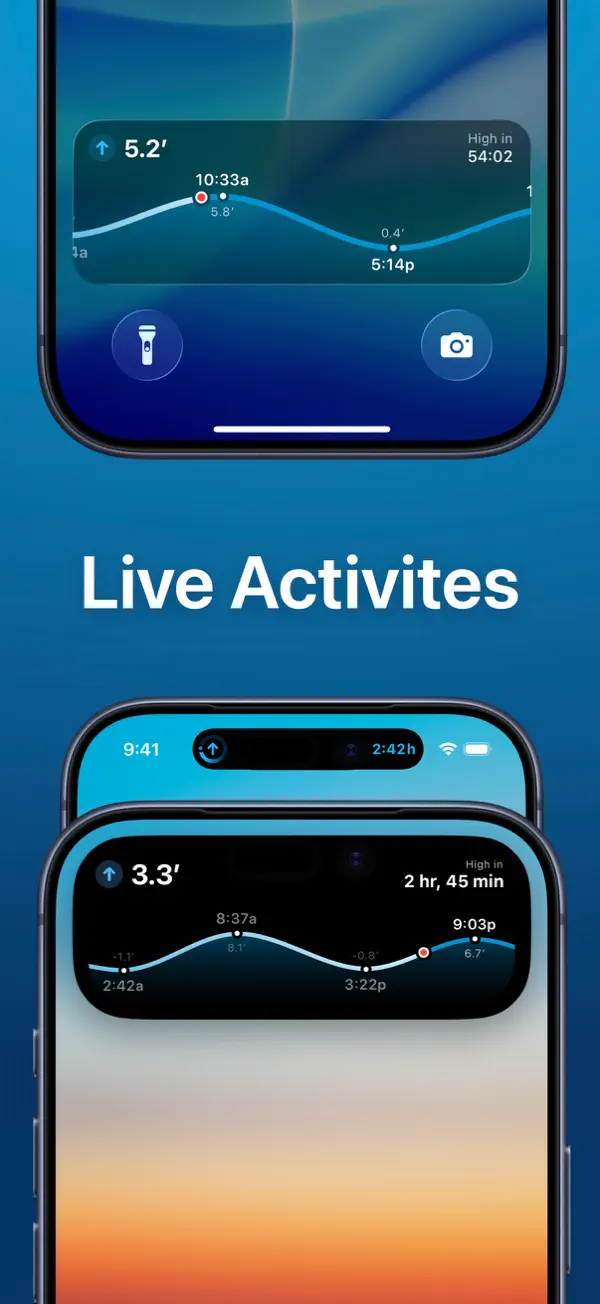
The current point has a small red ring around it. The line leading toward that point is white, and the section ahead continues in cyan. That distinction places the reading within the day. The same marker was visible on the station card, so opening the detail preserves a useful point of reference while giving it more room.
Times and heights appear beside the curve’s high and low points. The captured view labels an 8:58 AM peak at 5.3 feet and a 3:39 PM trough at 0.2 feet. Their placement connects each number to a particular feature of the line. The curve shows the shape of the change, and the nearby labels make its landmarks readable.
The rest of Today is arranged around that main explanation. A compact strip near the top holds weather readings. Solar and lunar times and a short sequence of tide events sit between the large status label and the graph. Those smaller details can be inspected without displacing the height, direction, or current point.
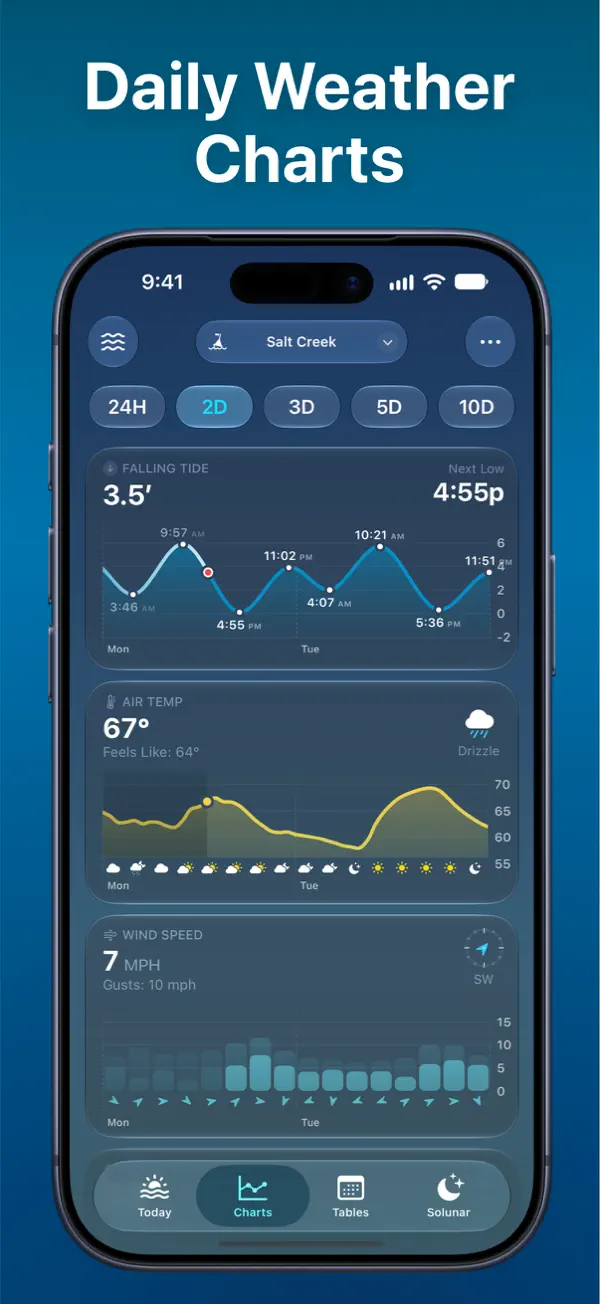
Switching to Charts increases the density while retaining that visual language. With 24H selected, three rounded cards stack vertically: tides, air temperature, and wind speed. The tide card keeps the familiar curve, 4.5-foot reading, and next-low time. The information that filled much of Today now occupies the first panel in a broader comparison.
The other cards use forms suited to their measurements. Air temperature follows a yellow line, with small weather icons along the time axis. Wind speed appears as cyan bars, accompanied by direction markers. Each card has a prominent reading and its own labels, while the repeated horizontal times give the collection a shared rhythm. Consistent framing holds the screen together without requiring every kind of data to look identical.
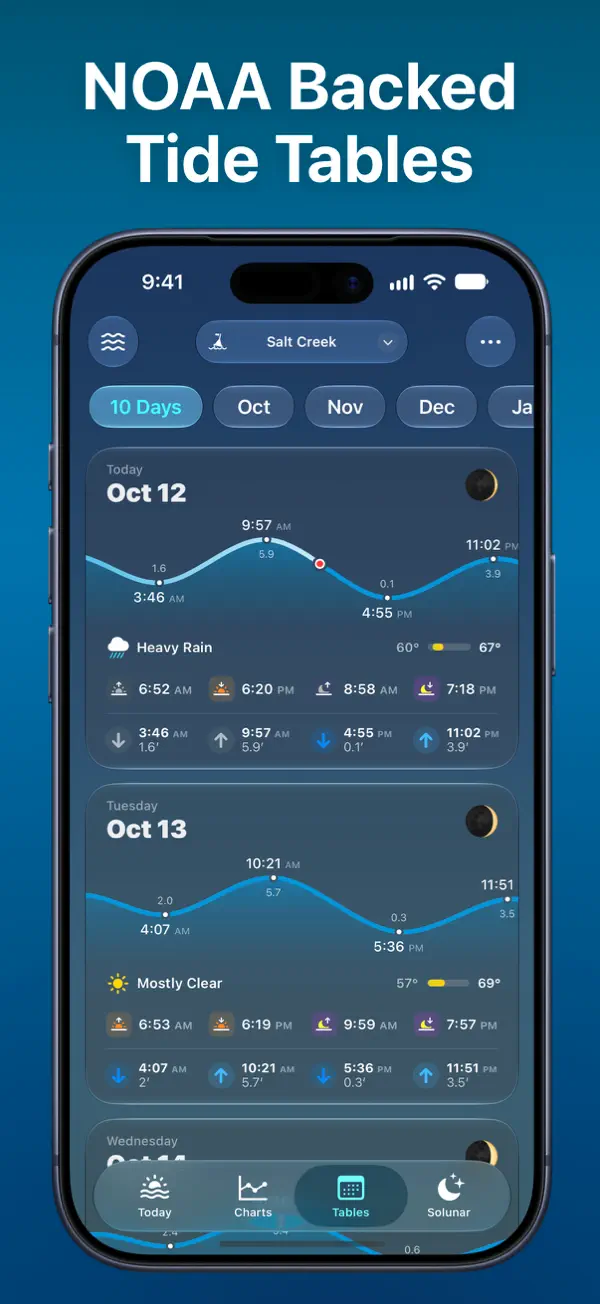
The official site describes interactive charts, tide tables, and additional coastal conditions across the app’s views. Its App Store listing identifies free and Pro features and notes that available data varies by region. The recorded example follows one named station through its populated screens.
Tide Guide’s curve serves several purposes at once. It is a compact preview in the station library, the main explanation on Today, and a familiar form that can sit beside other measurements. Keeping that shape and its current marker recognizable makes a denser collection of information easier to enter.
Independently selected. No paid placement.
Explore Tide Guide